candlekit/charts
The orchestration layer lightweight-charts leaves out — drawing tools, indicators, measurement, and deterministic replay — in one tree-shakeable, framework-agnostic package.
One unified workspace. Every pane is a full chart — drawing tools, indicators, measurement and bar-by-bar replay attached to the pane. Split, resize and sync more chart panes via FlexLayout.
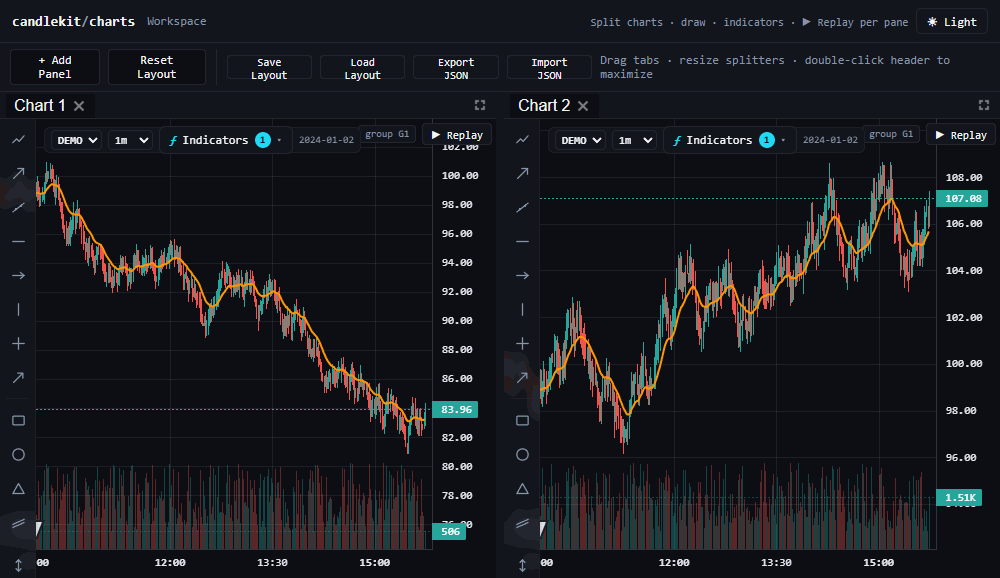
▸ Unified workspace — add panes · resize · replay
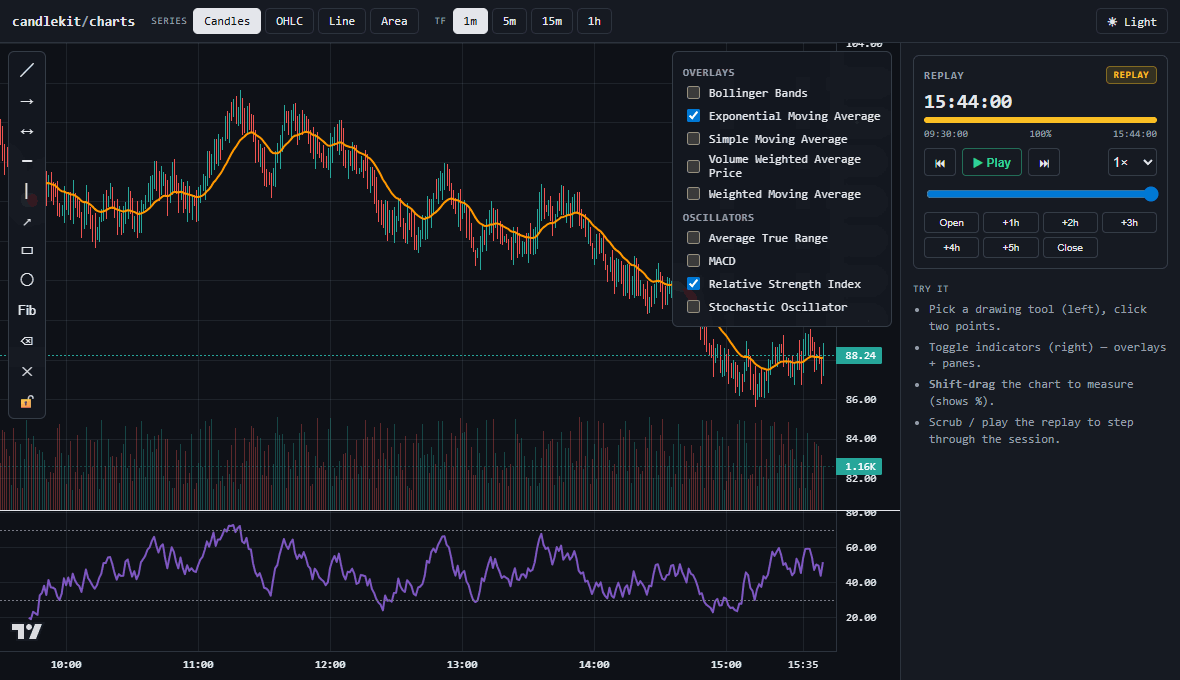
▸ Drawing tools — trendline · rectangle · fib · ruler
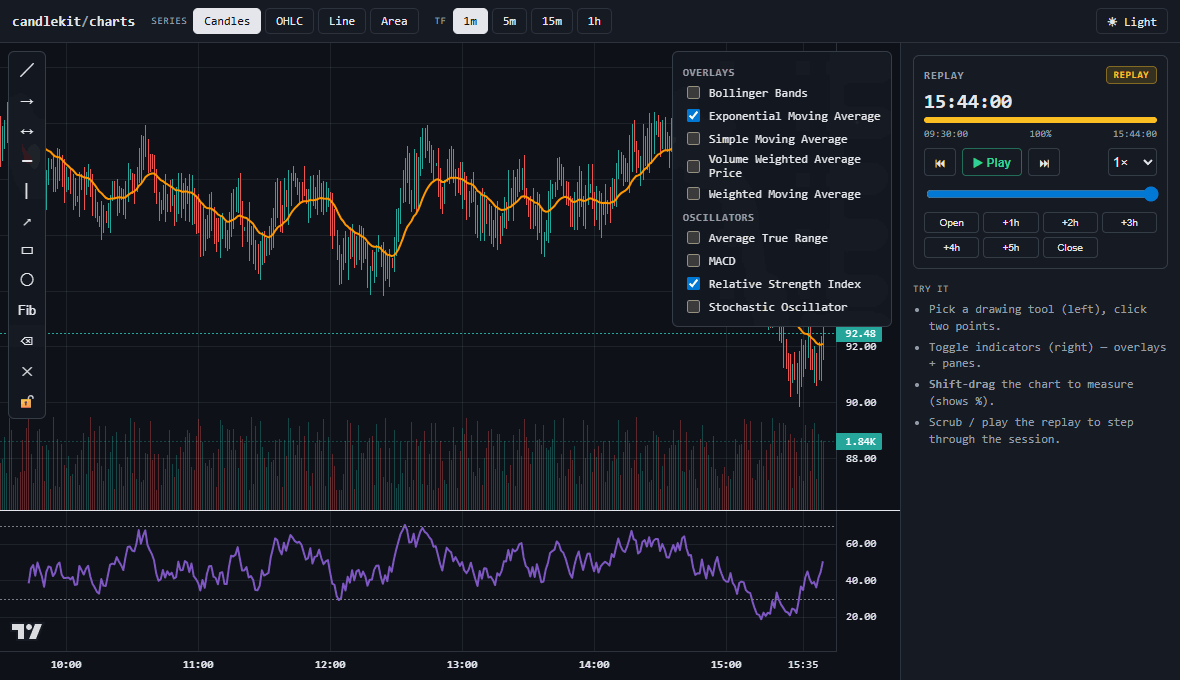
▸ Indicators — Bollinger · MACD · SMA · RSI
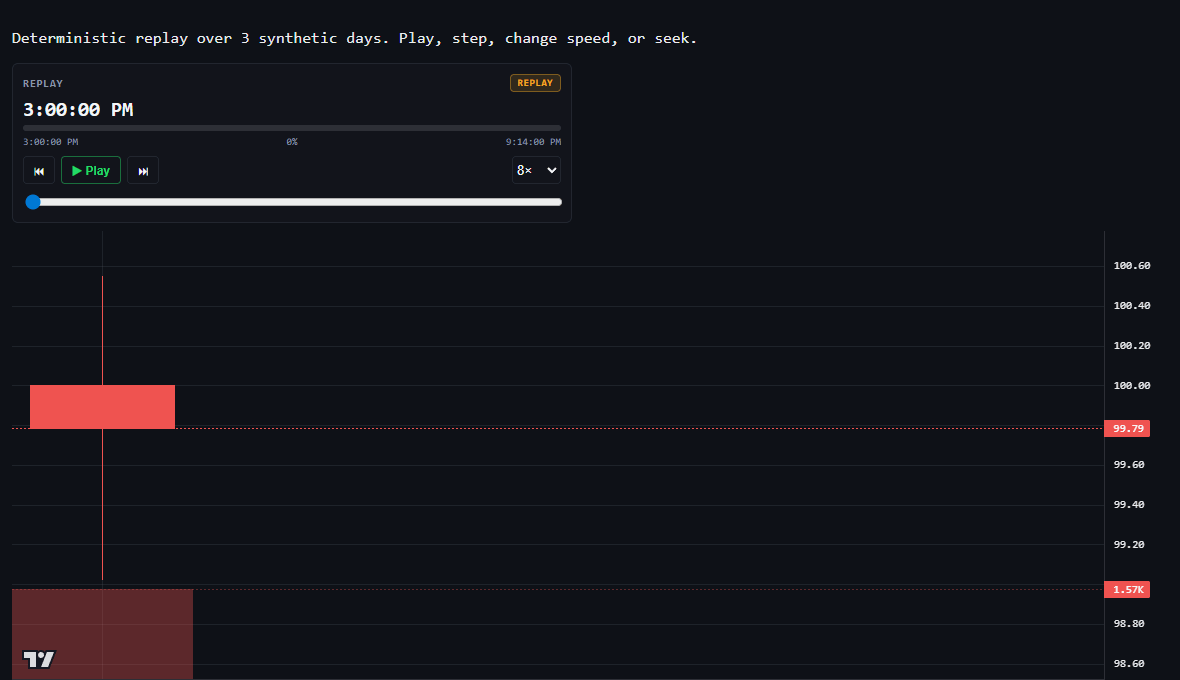
▸ Replay — deterministic bar-by-bar scrub
Focused examples
Smaller, single-purpose apps — each isolates one part of the API.
▸ Vanilla JS
ChartController, series types (candles / line / area / volume), theme toggle. No framework.
▸ React
<ChartView> with series + timeframe + theme controls via the optional React bindings.
▸ Indicators
Built-in catalog — SMA, EMA, Bollinger, RSI, MACD, ATR, Stochastic — in a dropdown picker.
▸ Drawing tools
Trendlines, rays, rectangles, fib + the measurement ruler. Drag, select, persist.
▸ Replay
Deterministic bar-by-bar replay with play / pause / speed / scrub controls.
Quick start
# one peer dependency — no git URLs, no copyleft
npm install @getcandlekit/charts lightweight-charts